In 2022
Help protect younger children from sexual abuse.
Every 2 minutes our analysts in Cambridge remove a photo online of a child suffering sexual abuse.
As one of the world’s leading organisations fighting online child sexual abuse we rely on the generous support of members of the public, charitable giving bodies and the business community. Your support will help us continue and increase our vital work helping these victims.
People report to us at iwf.org.uk, or through one of the 50 Reporting Portals around the world, in multiple languages. All reports are assessed at our headquarters in the UK. We also actively search the internet for child sexual abuse imagery. We call this, ‘proactive searching’.
We use the term ‘actioned’ to indicate a report which was found to contain child sexual abuse material, which we therefore took a number of active steps to remove from the internet.
You can read more about UK-hosted and globally-hosted child sexual abuse material.
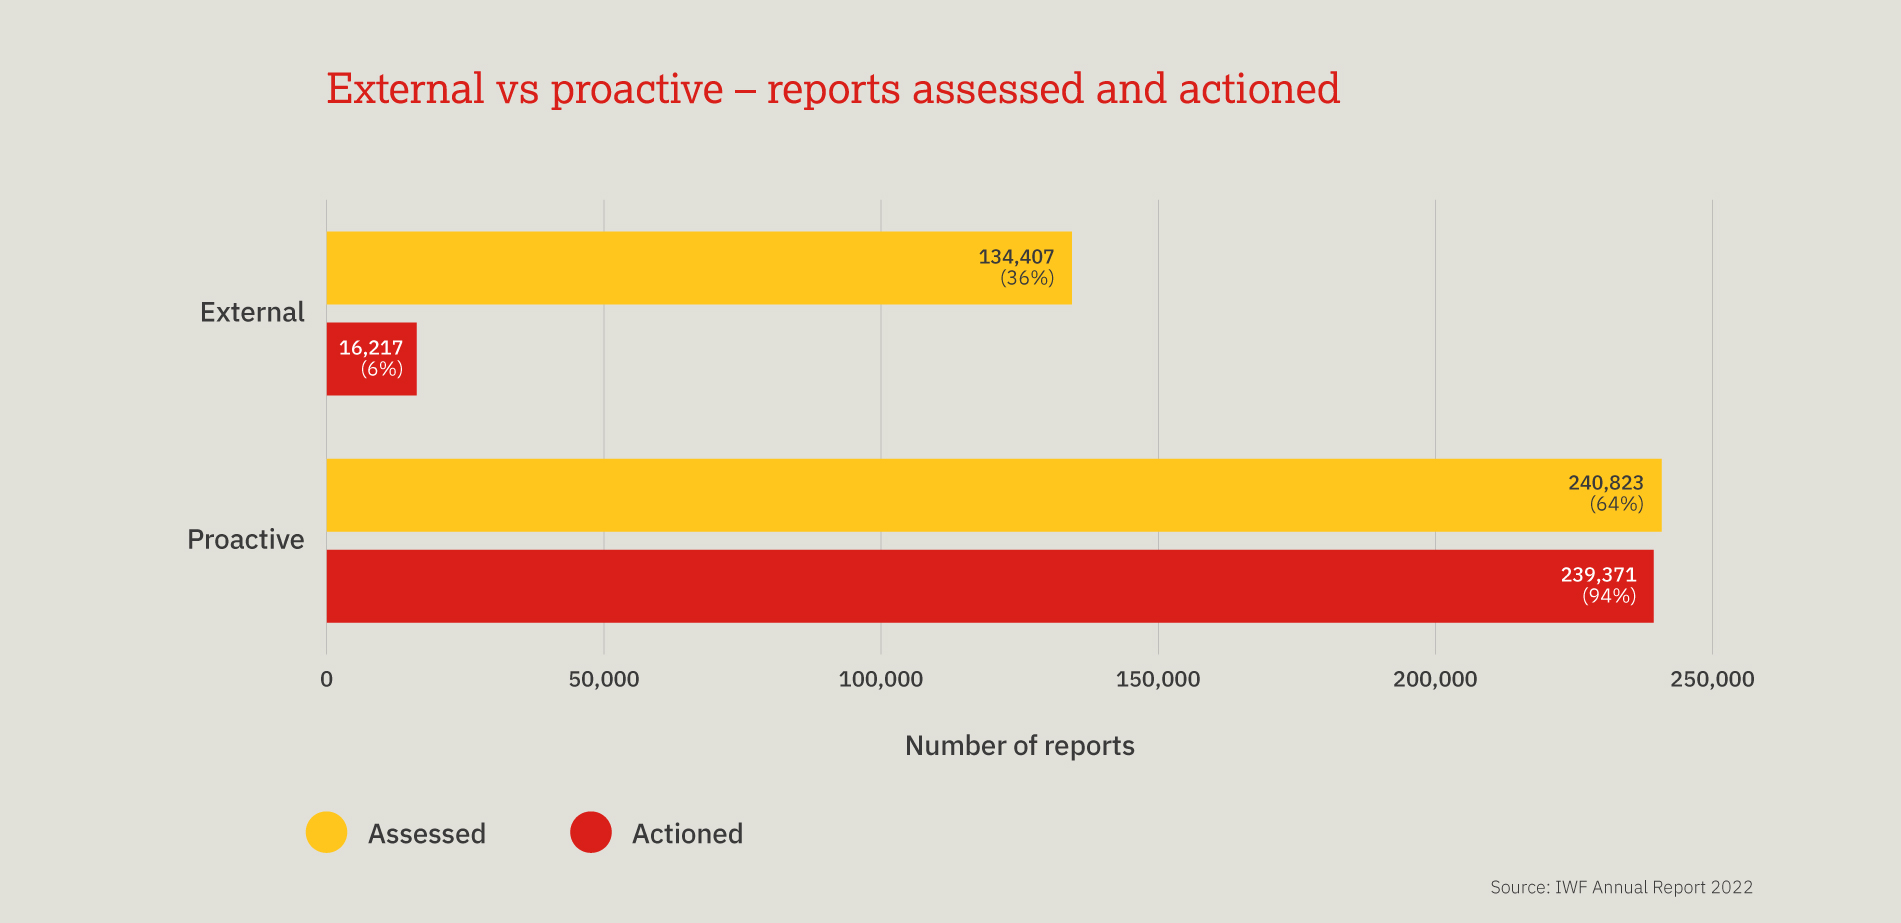

This chart compares proactively sourced reports (where our analysts search for content) and those reports which came to us via external sources.
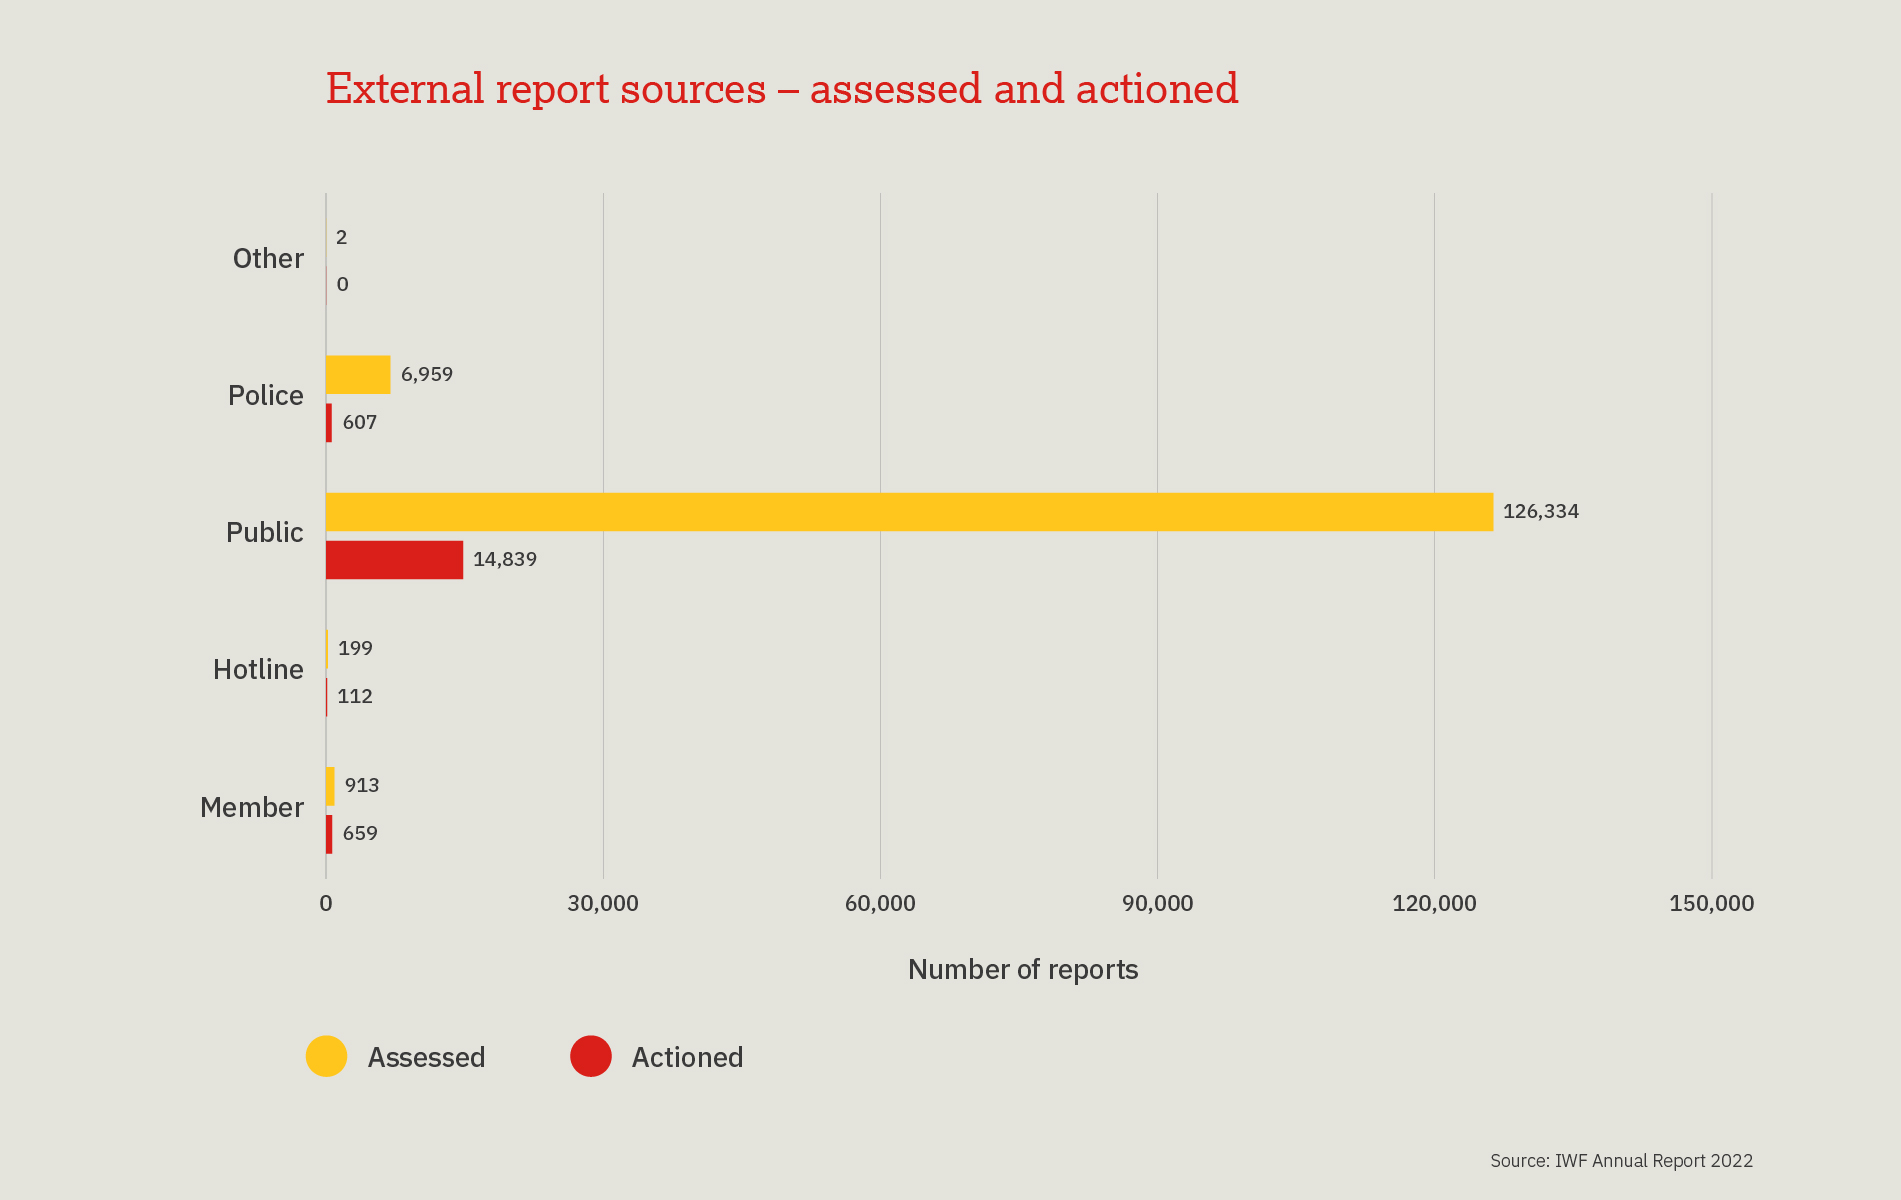

This chart shows a breakdown of the external sources which report into us and report numbers from each source. The five sources are: Public, Police, Member, Other and Hotline.
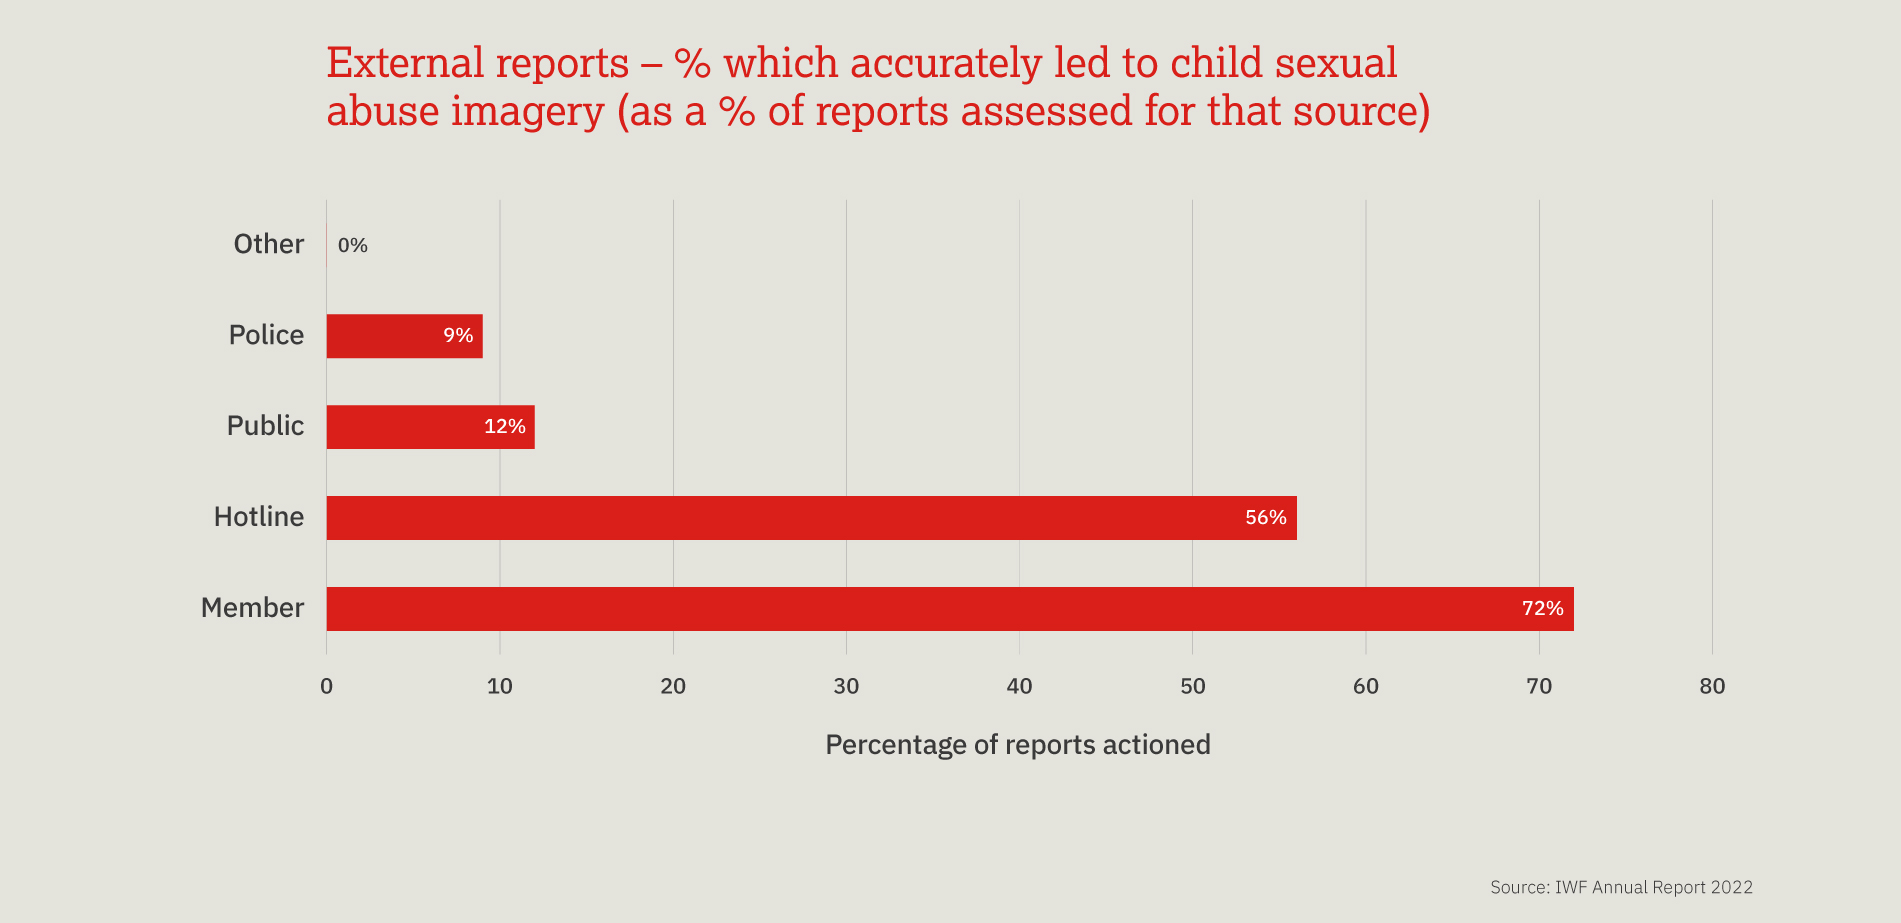

Chart showing the percentage of reports which were actionable (contained child sexual abuse material) from each external source. The five sources are: Public, Police, Member, Other and Hotline.
126,334 reports were assessed by our Hotline which came from the public. 26% (29% in 2021) of these reports correctly identified child sexual abuse content. This figure includes newsgroups and duplicate reports (where the same criminal URL has been reported multiple times).
Note: Each year, a number of these are adverts or links to child sexual abuse material.
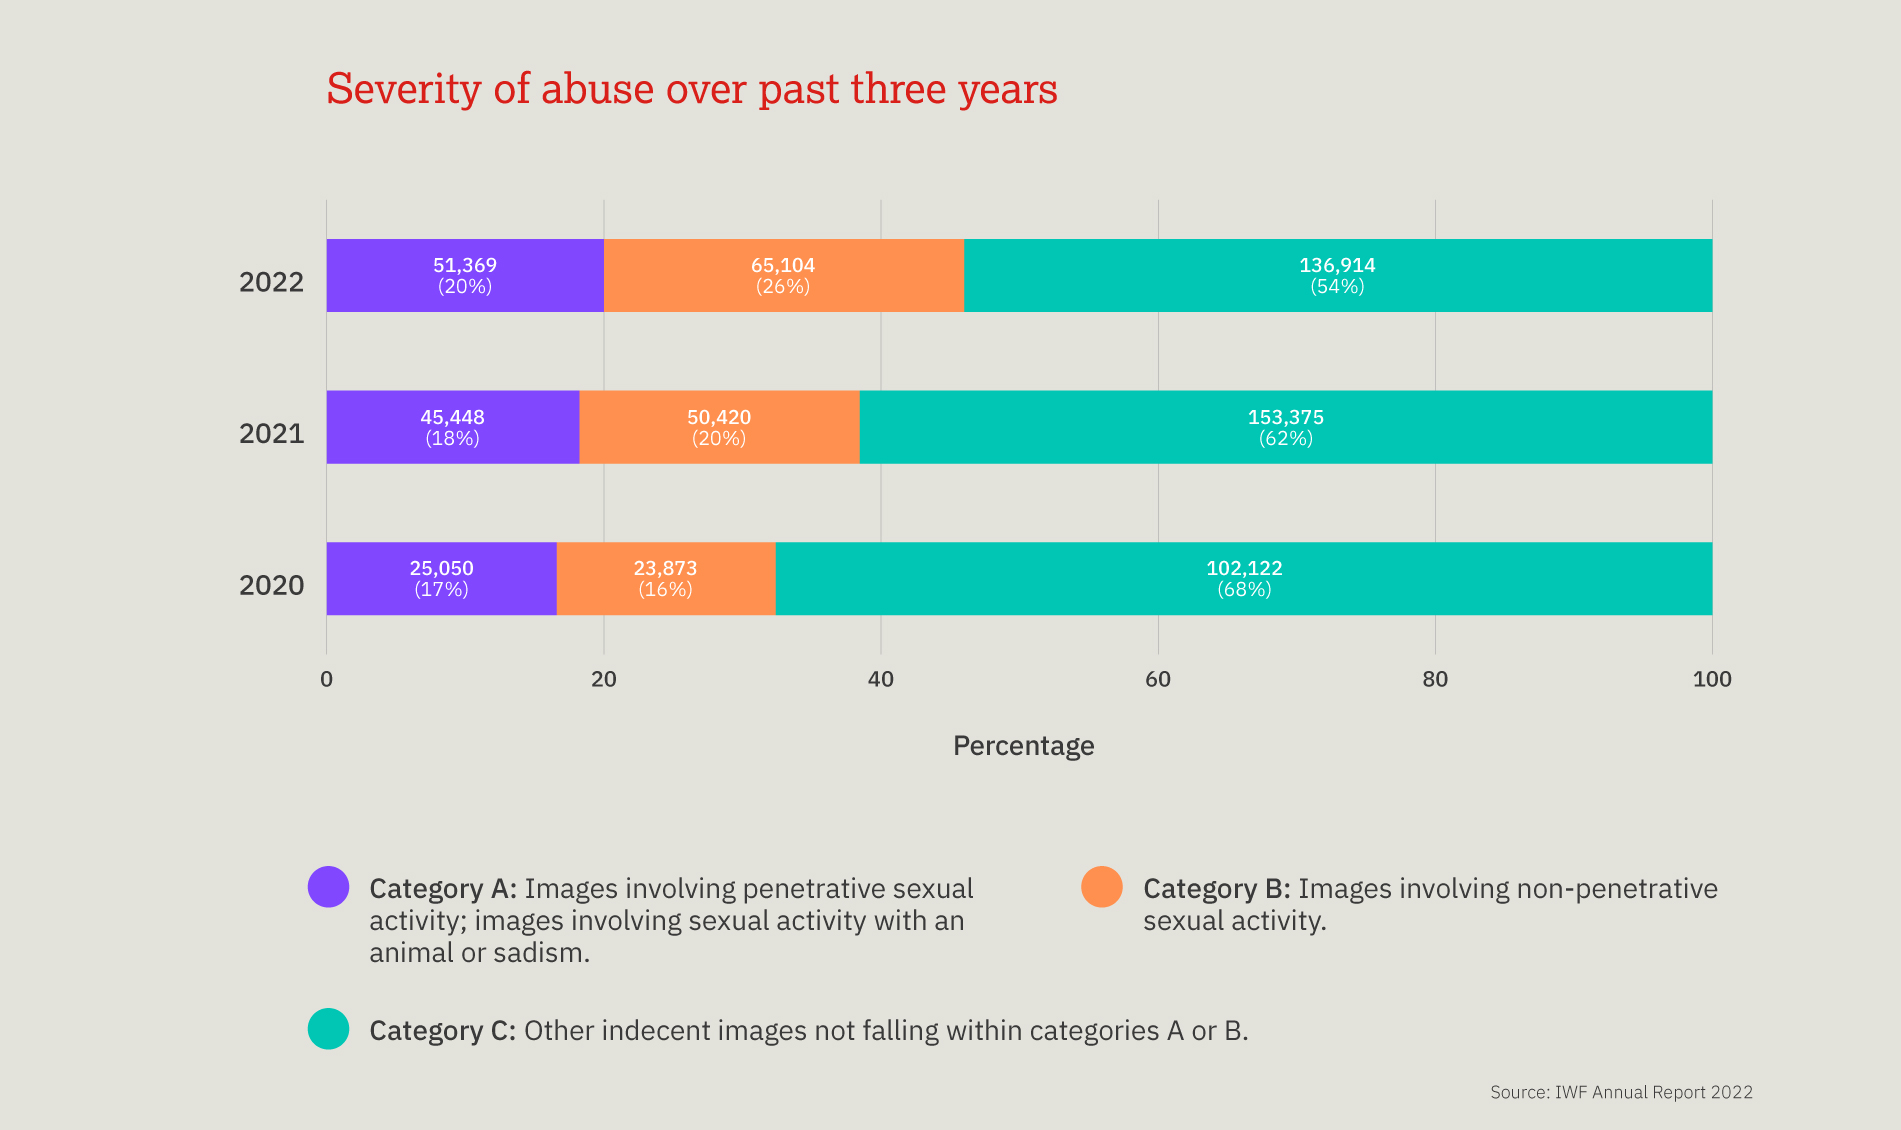

This chart shows the severity of child sexual abuse according to UK Category A, B and C.